Linguistic diversity map of South Africa
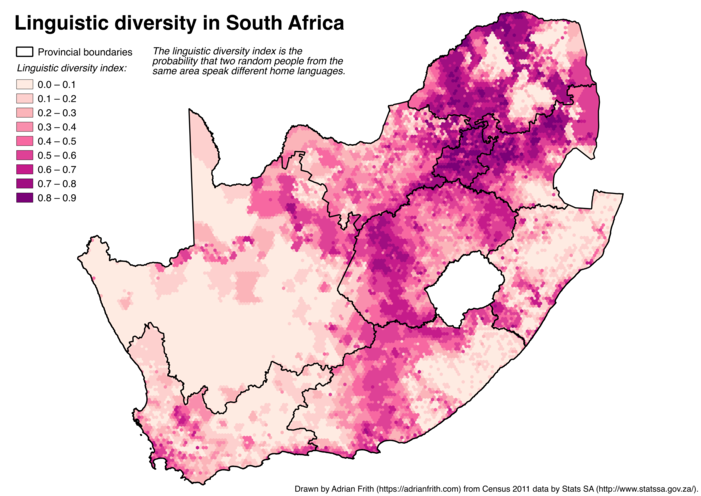
The linguistic diversity index measures the probability that two people selected at random from a population speak different home languages. The map below, which I produced, depicts the linguistic diversity index calculated on a 10-kilometre-wide hexagonal grid across South Africa.

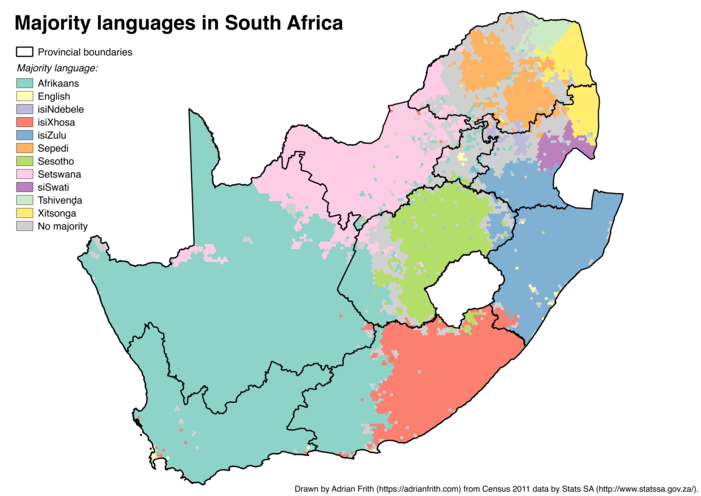
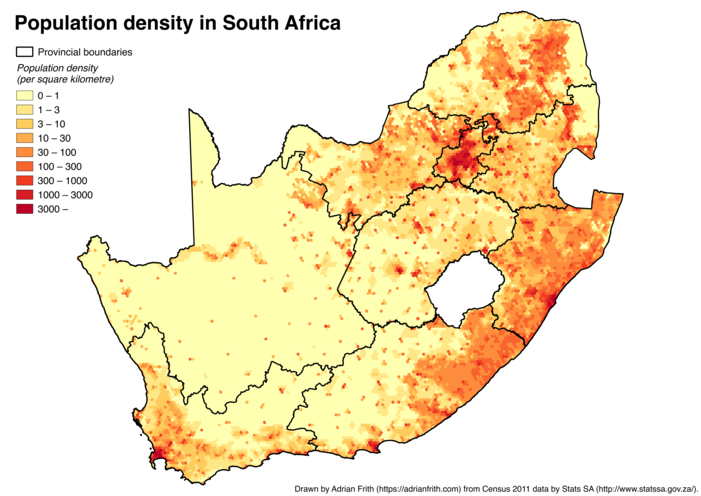
For comparison, here are maps of the majority home language and population density calculated for the same hexagons.
The map is based on the answers given to the home language question in the 2011 census. The most detailed dataset published from the census was the “Small Area Layer”, which gives aggregated data for “small areas” of about 150 households. Using PostGIS I constructed a grid of 10-kilometre-wide hexagons covering South Africa. I then calculated the language data for each hexagon from the small areas that fall within that hexagon. Where a small area falls across multiple hexagons I divided its population proportionally.
The index is calculated according to the “monolingual nonweighted method” formula from Joseph Greenberg’s paper “The Measurement of Linguistic Diversity”. Assume there are n languages, and let pi be the fraction of the population that speak language i. (So p1 + p2 + ⋯ + pn = 1.) Then the index is given by 1 − (p12 + p22 + ⋯ + pn2), i.e. one minus the sum of the squares of the fractions.
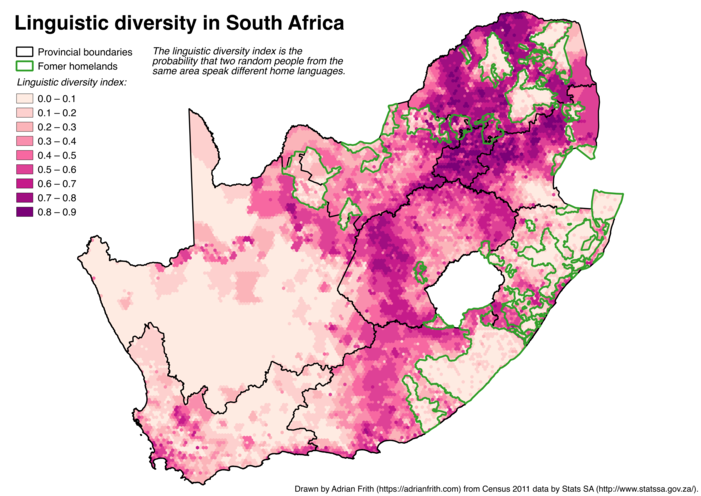
An interesting feature to note is that the former “homelands” — ethnically segregated territories under the apartheid system — are closely correlated with low linguistic diversity. Below is the first map with the homeland boundaries overlaid.

The code I used to create the hexagonal grid and calculate the linguistic diversity index can be found in this GitHub repository.

